Where is the wisdom we have lost in knowledge? Where is the knowledge we have lost in information? -- T.S. Eliot
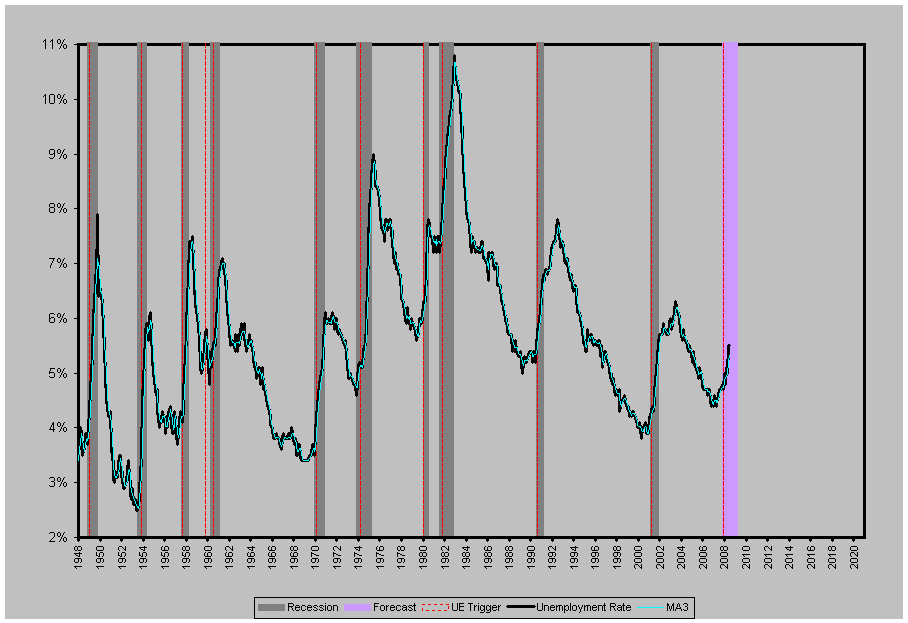
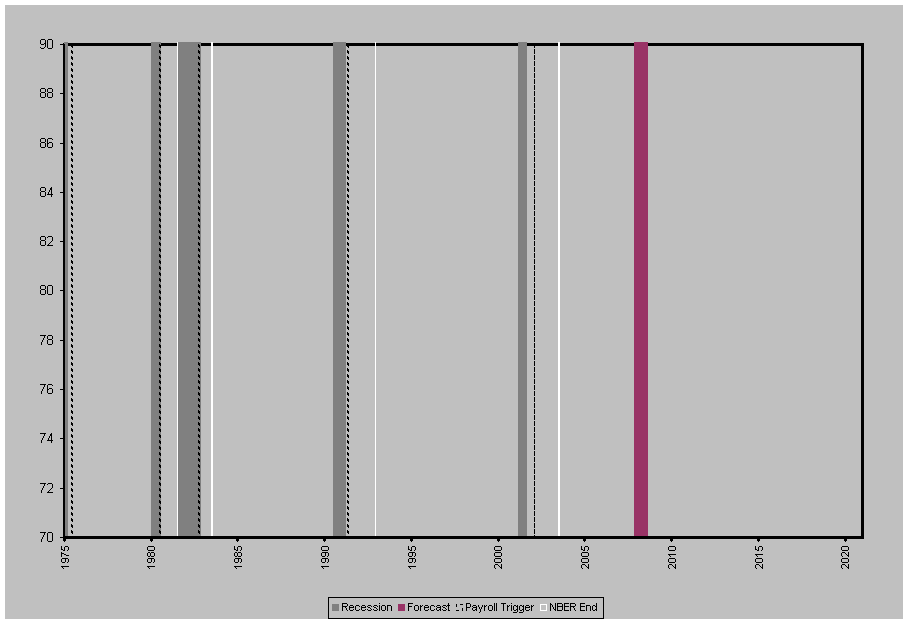
Recession forecast based on a start of Nov-07 and post-WWII average length of 10 months, to Aug-08.
RECESSION INDICATORS
|
Where is the wisdom we have lost in knowledge? Where is the knowledge we have lost in information? -- T.S. Eliot |
|
|
|
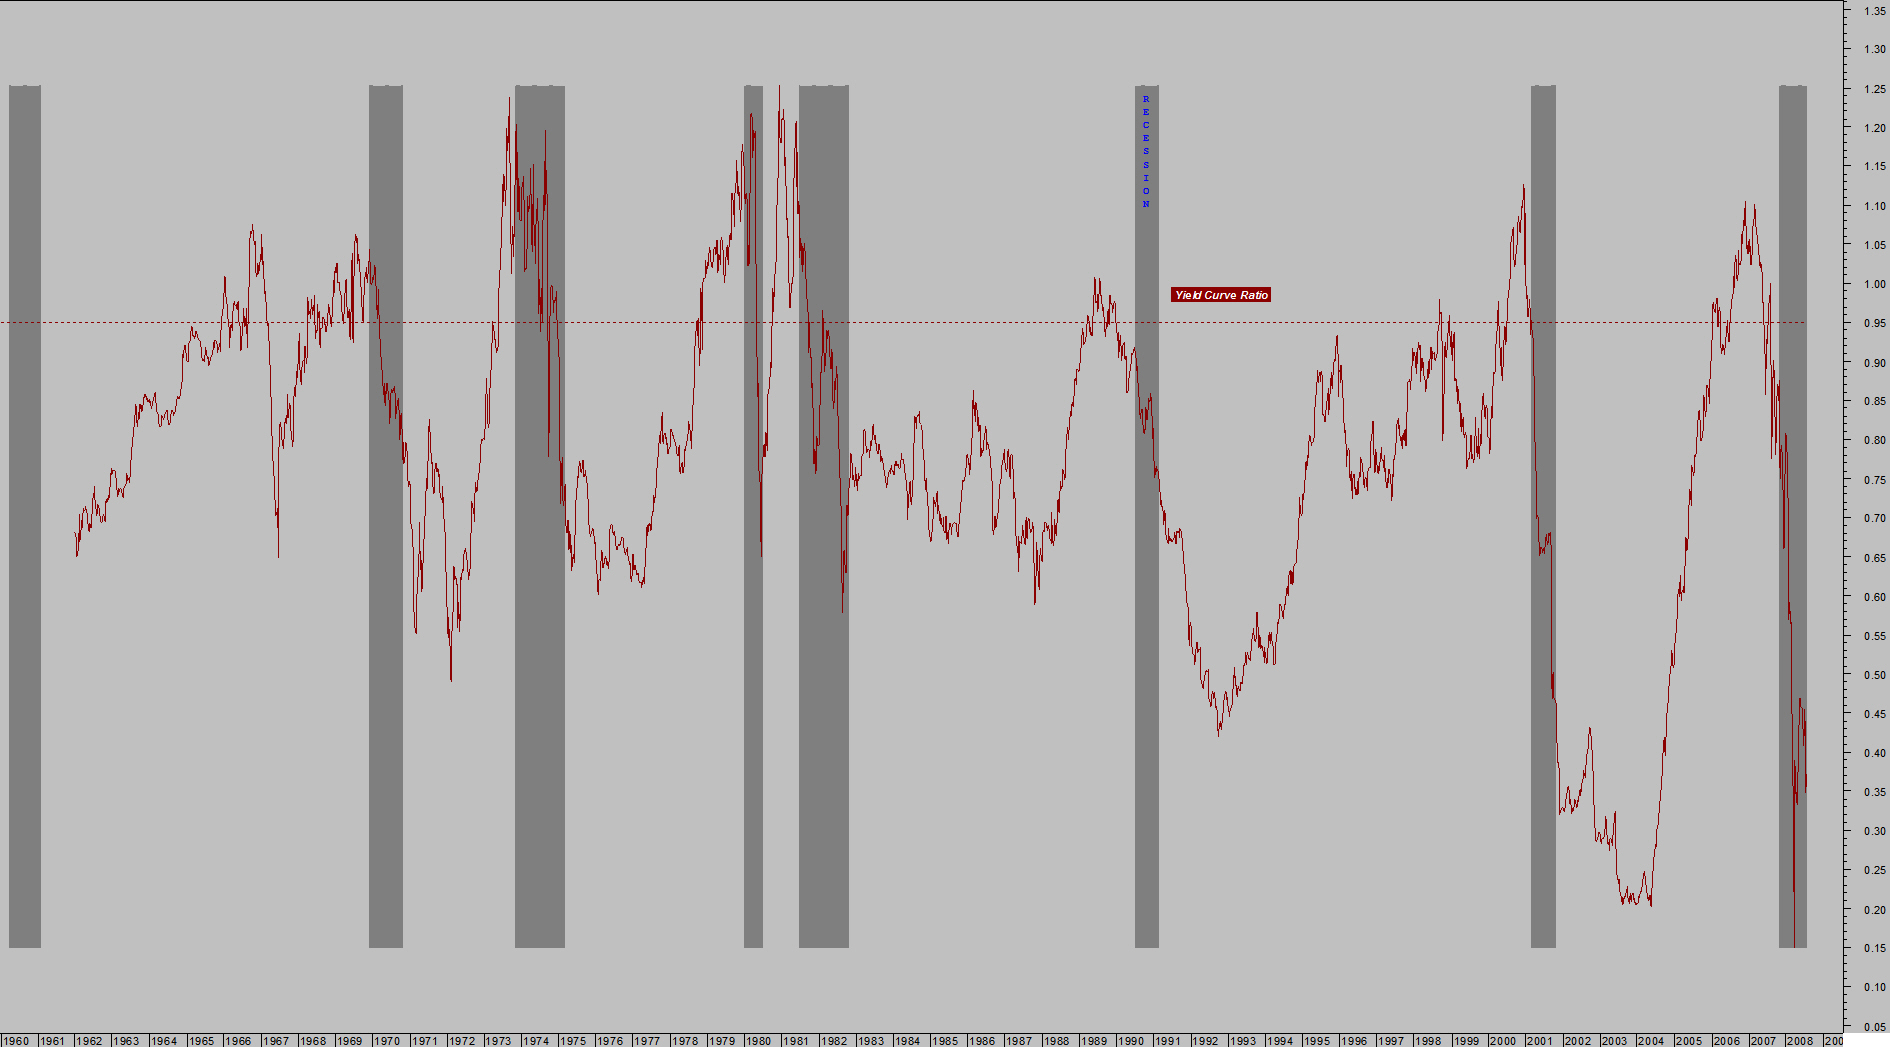
| Leading indicator, long-term (avg. 18 months): Yield Curve ratio, 3-month vs. 10-Year Treasury Yields | Coincident/Lagging indicator: Key
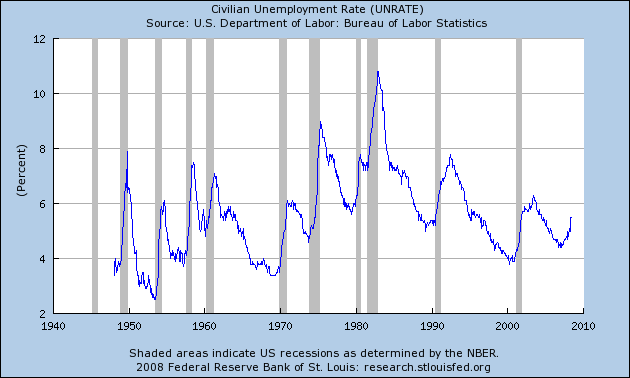
change in Unemployment Rate. Recession forecast based on a start of Nov-07 and post-WWII average length of 10 months, to Aug-08. |
|
|
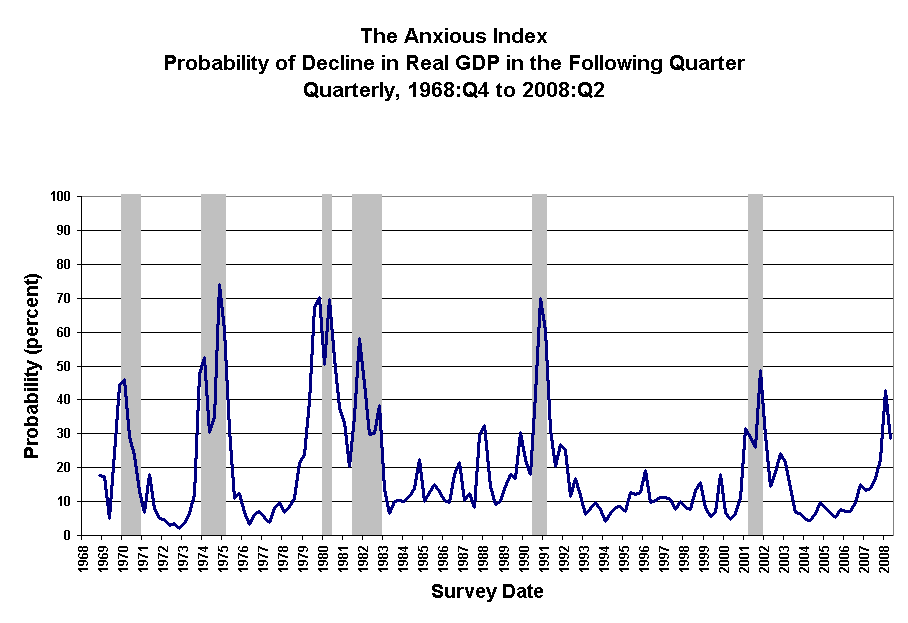
| Lagging indicator: Anxious Index vs. Recession | n/a |
RECOVERY INDICATORS
 |
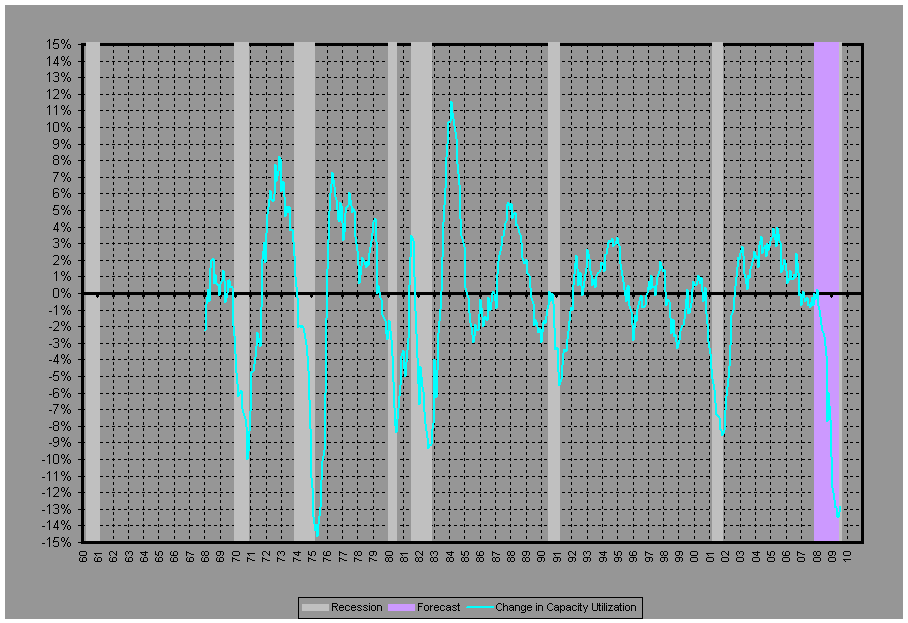 |
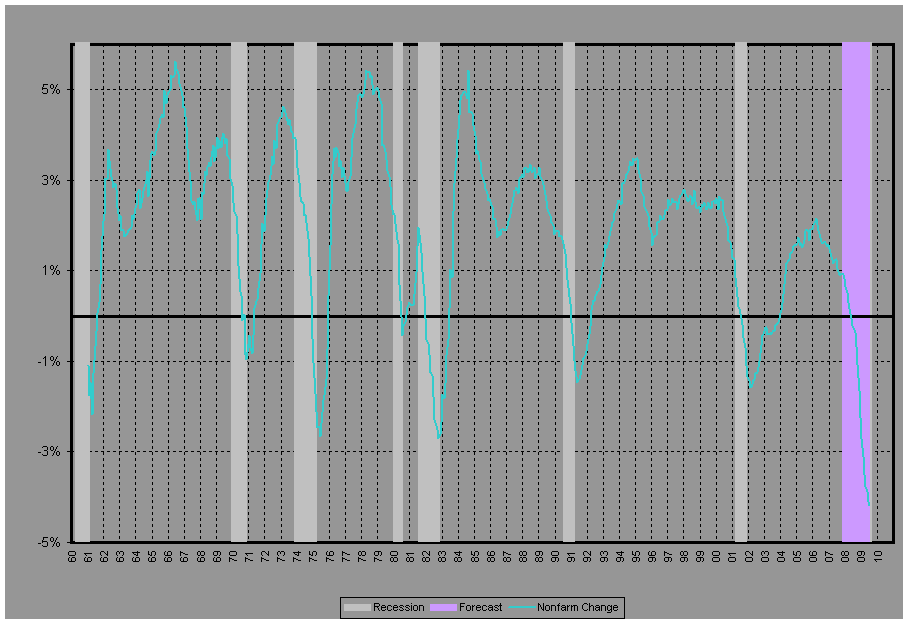
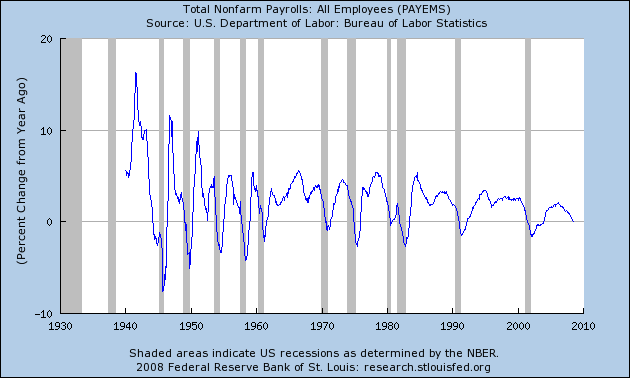
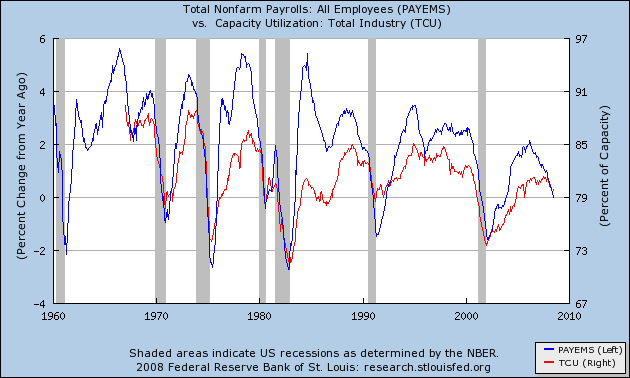
| Establishment Survey: Total Employees | Trough in Capacity Utilization |
 |
n/a |
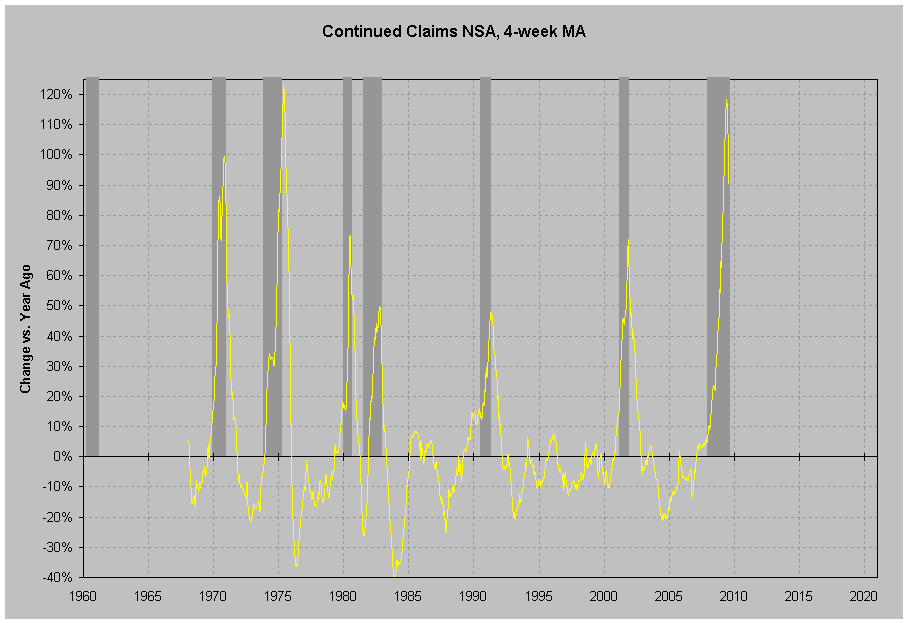
| Continuing Claims: History + Current | |
 |
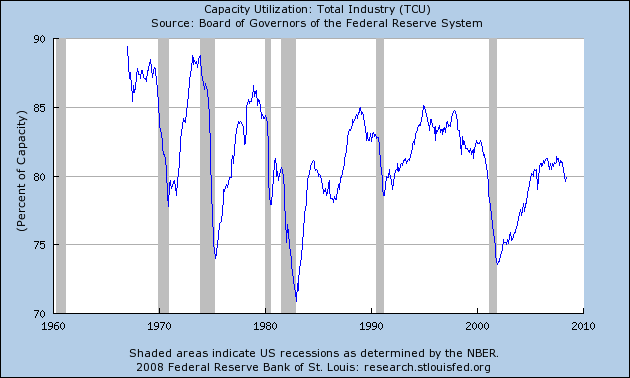 |
| Establishment Survey: Total Employees | Trough in Capacity Utilization |
 |
 |
|
Trough in Capacity
Utilization and Total Employees (000's), or trough in Capacity Utilization and Total Employees (% year-ago) |
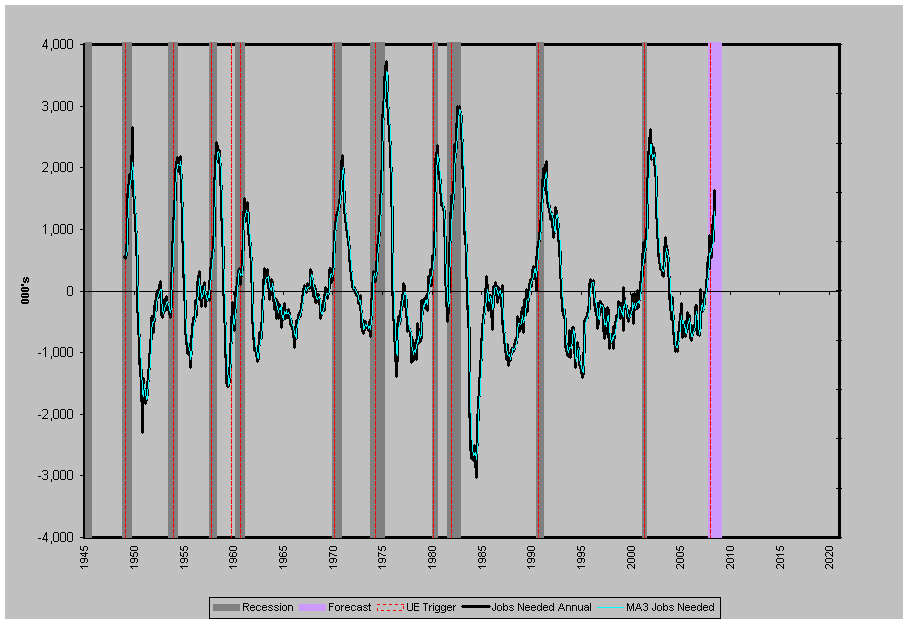
Household Survey: Peak in Jobs Needed (Labor Force & Civilian Employment) |
| Recovery (current estimate as of Jul 08): 2H09 | |
 |
|
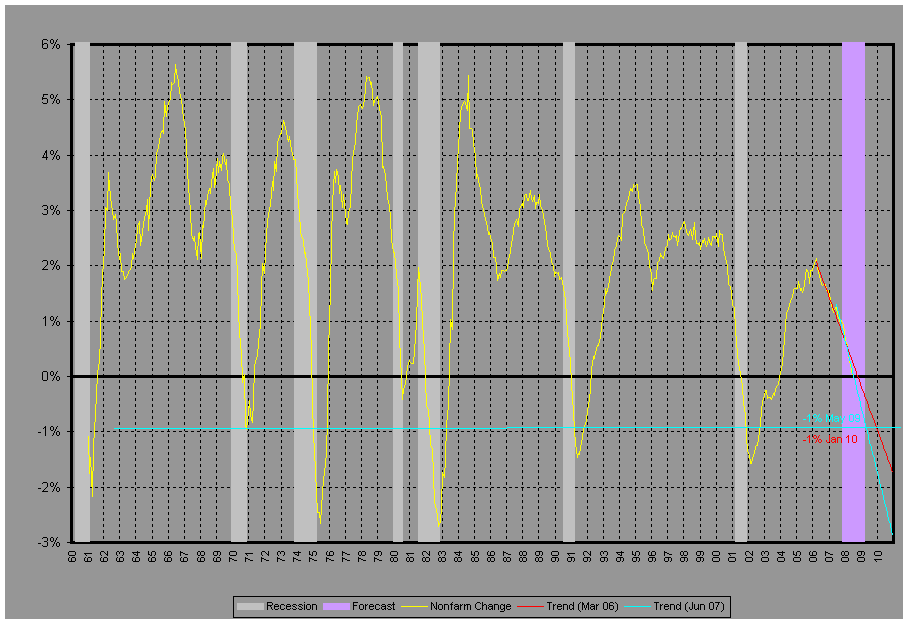
| Trendline estimate from Nonfarm Employment: May 09 - Jan 10 | Trendline estimate from Capacity Utilization: Dec 08 - Sep 09 |
Select Business Cycle Dating
 |
 |
| Recession | Recovery |
|
Actual vs. Announcement, 1980 - Current
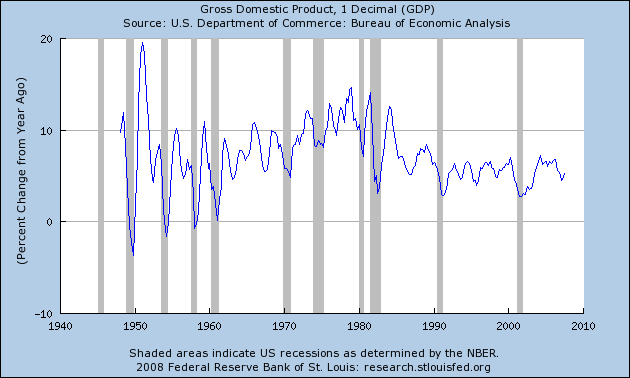
"The NBER does not define a recession in terms of two consecutive quarters of decline in real GDP. Rather, a recession is a significant decline in economic activity spread across the economy, lasting more than a few months, normally visible in real GDP, real income, employment, industrial production, and wholesale-retail sales." |
|||||||||||||||||||||||||||||||||||||
 |
 |
||||||||||||||||||||||||||||||||||||
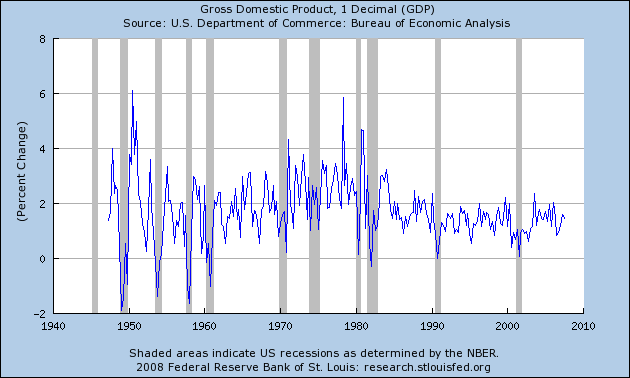
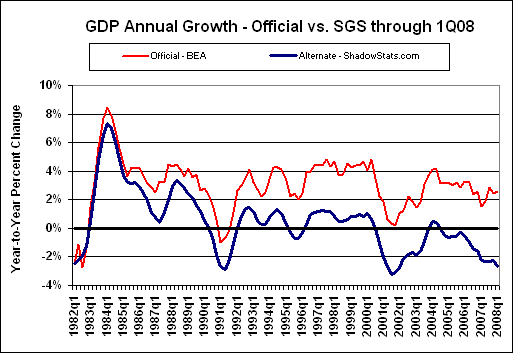
| GDP Annual Change | GDP Quarterly Change | ||||||||||||||||||||||||||||||||||||
|
|
|
 |
 |
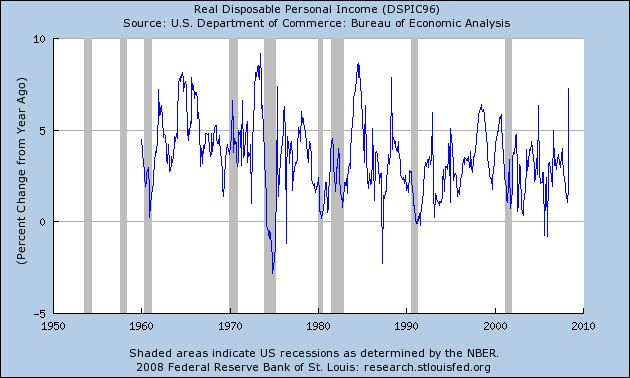
| Real Disposable Income | Unemployment Rate |
|
|
|
 |
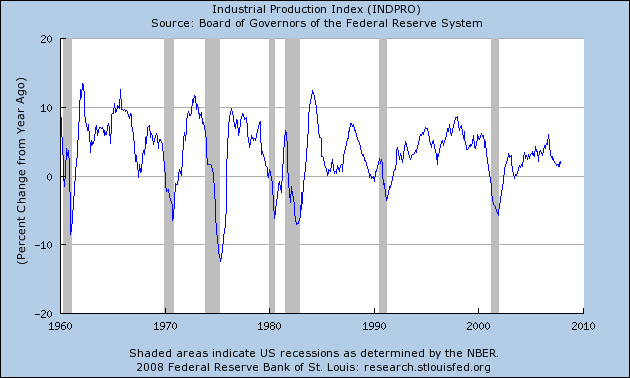 |
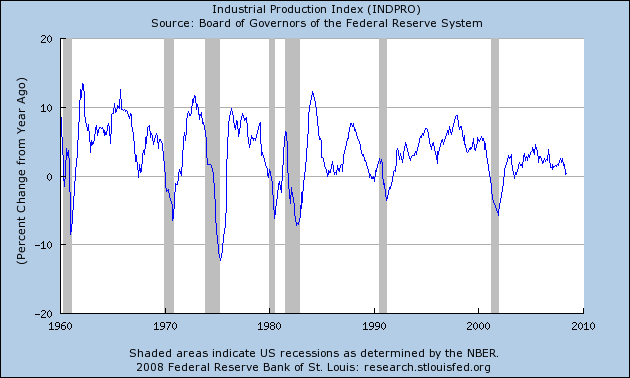
| Industrial Production | Industrial Production 1960 |
|
|
|
 |
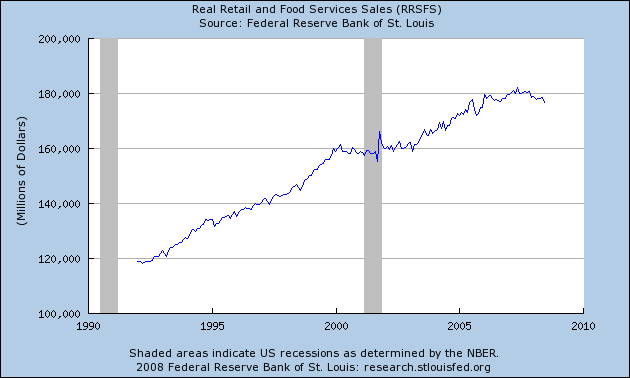 |
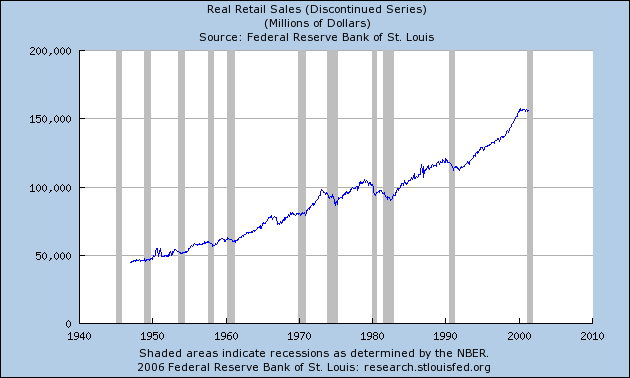
| Real Retail Sales (discontinued) | Real Retail and Food Service (current) |
|
|
|
| n/a | |
| Wholesale/Trade Sales | n/a |
OTHER INDICATORS
 |
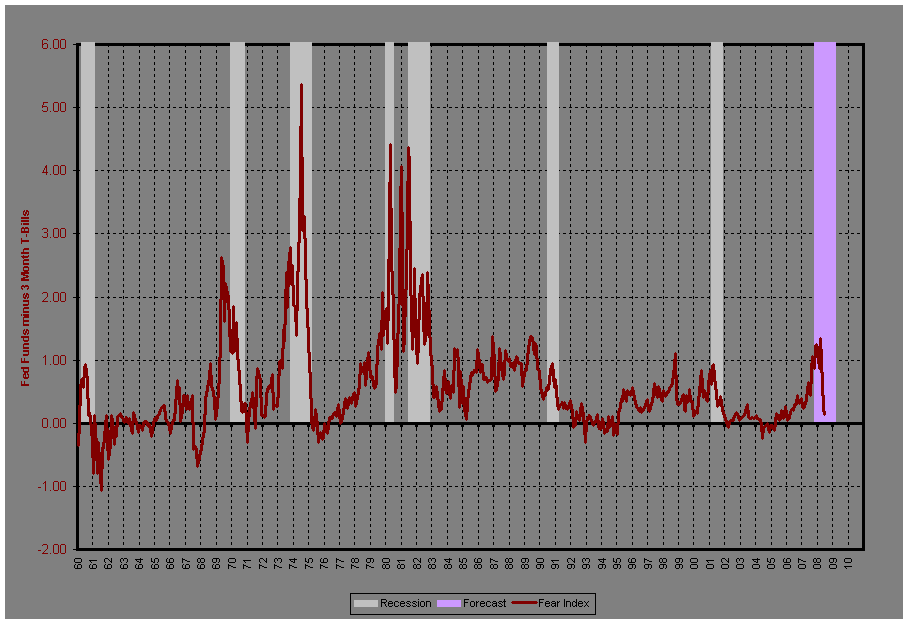 |
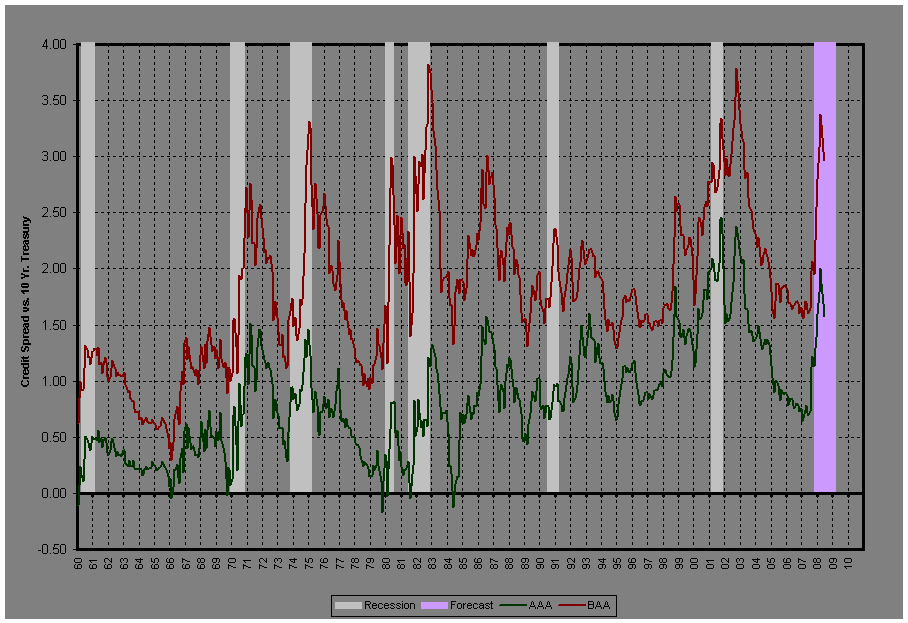
| Credit Spread, AAA & BAA | FEAR INDEX: Effective Federal Funds Rate minus 3-month T-Bills. |
 |
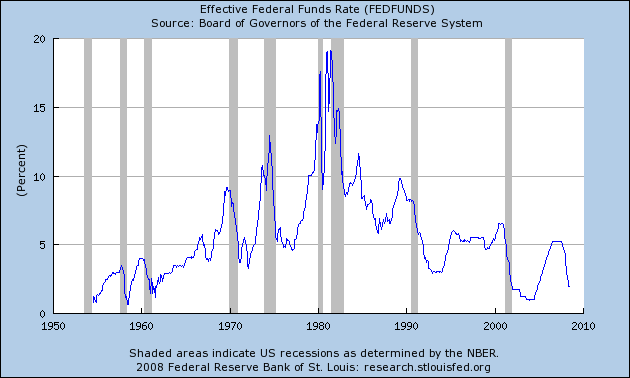 |
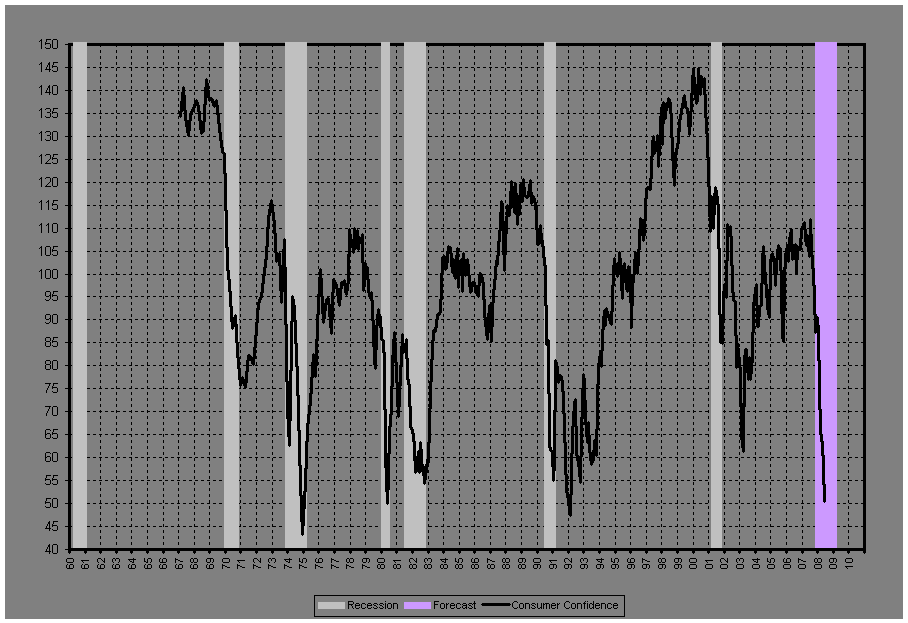
| Peak in Consumer Confidence | Effective Federal Funds Rate (H.15) FOMC Mtg Dates |
EMPLOYMENT DETAIL
 |
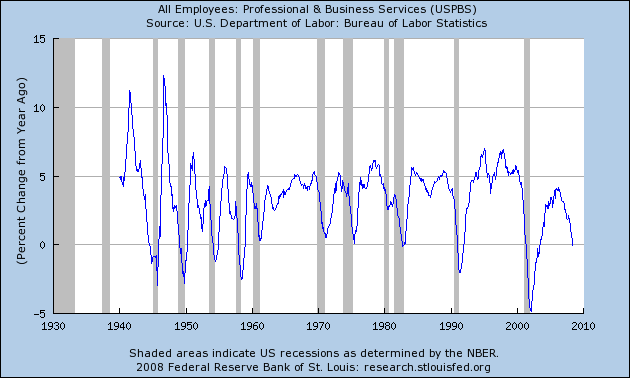 |
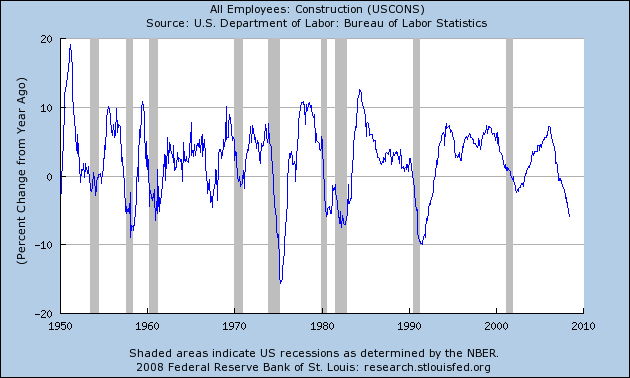
| Construction Employment | Employment, Professional & Bus. Svcs |
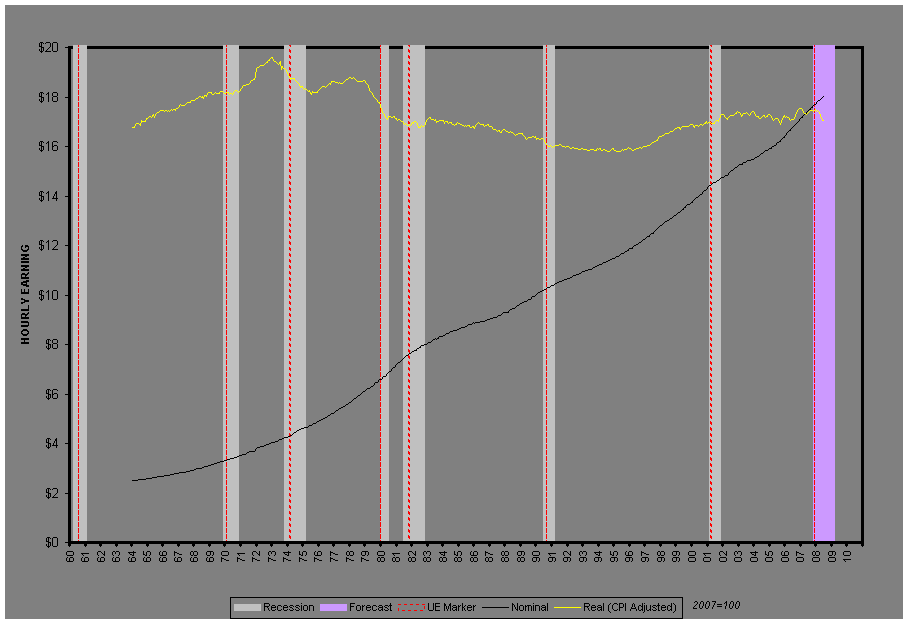
| Real Income | |
 |
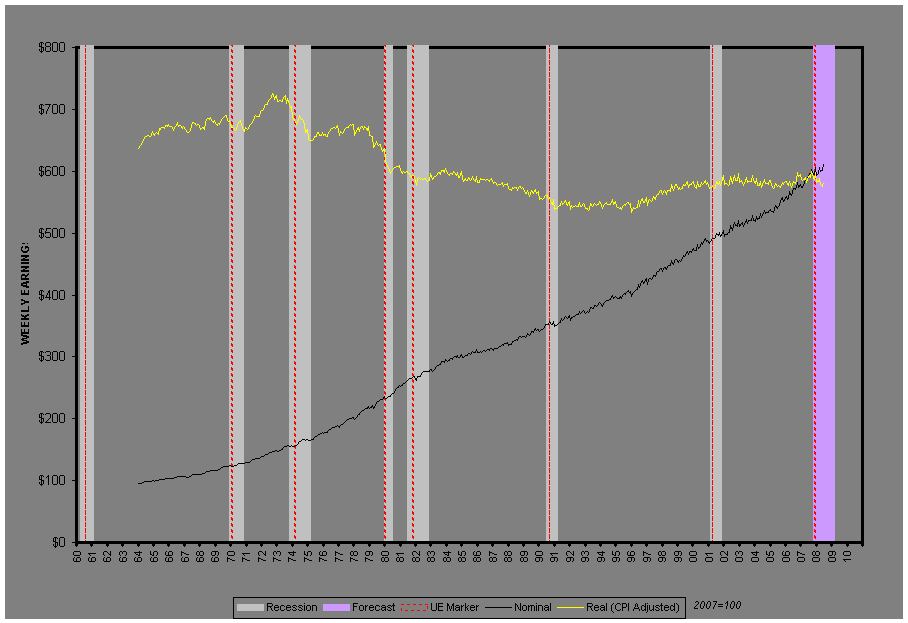 |
| Hourly Earnings , Nominal vs Real (CPI), -1.7%, 1964-2008 | Weekly Earnings , Nominal vs Real (CPI), -8.8%, 1964-2008 |
HOUSING
 |
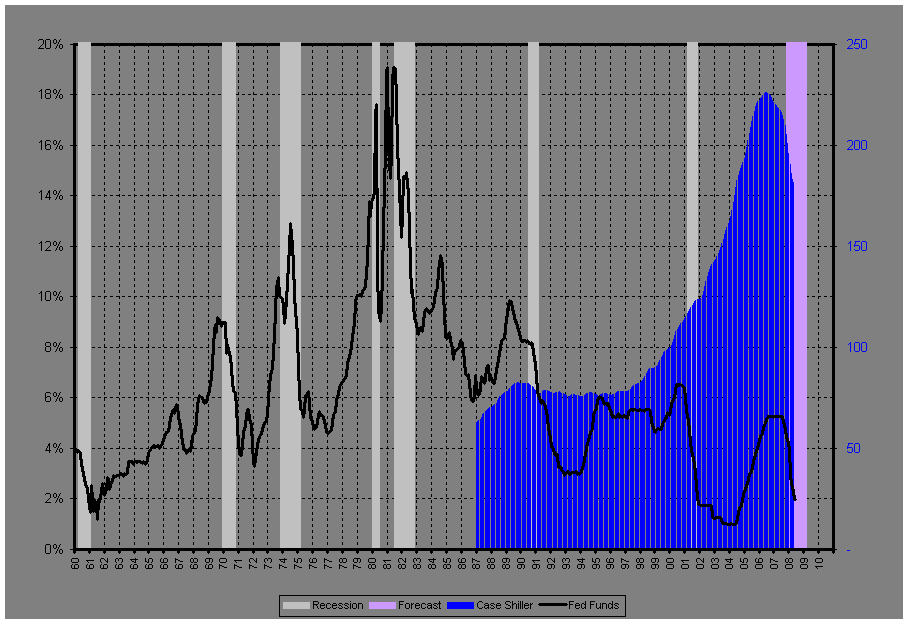 |
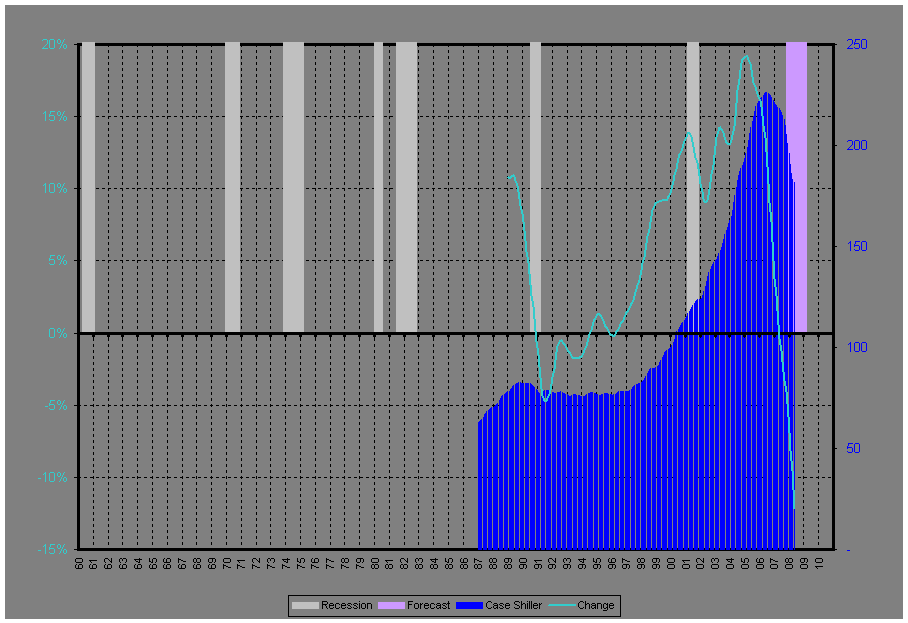
| Case-Shiller Index | Case-Shiller Index vs Effective Federal Funds Rate |
 |
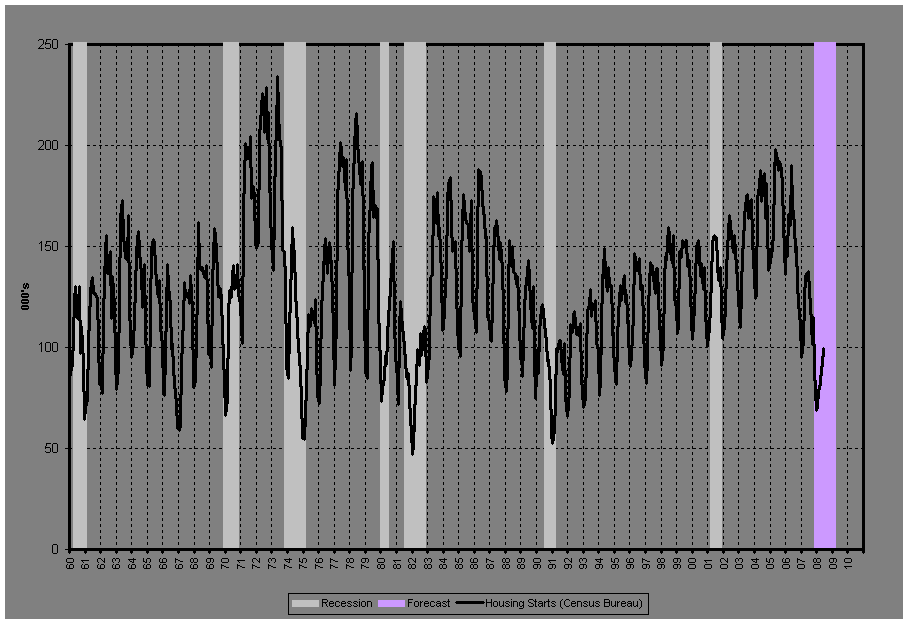 |
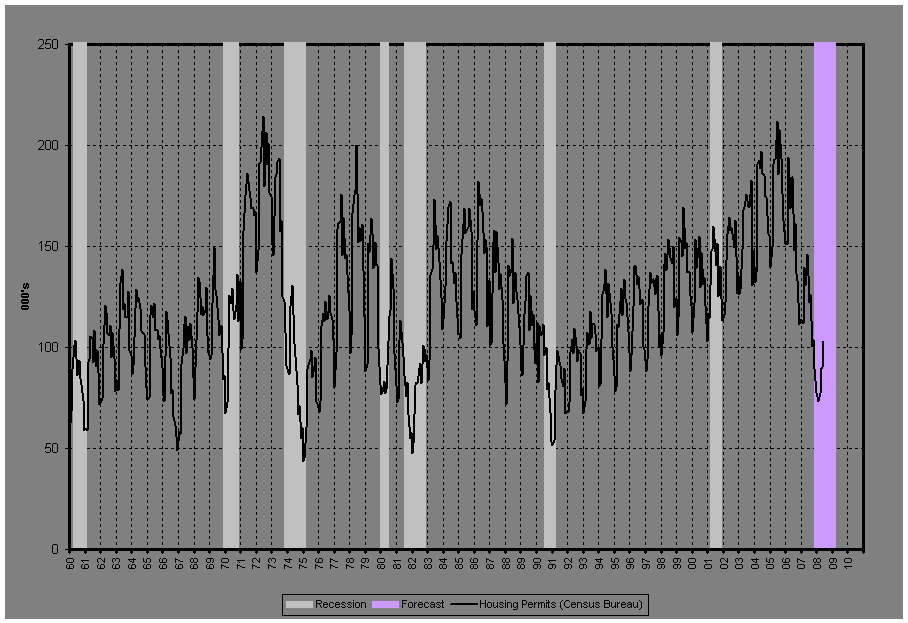
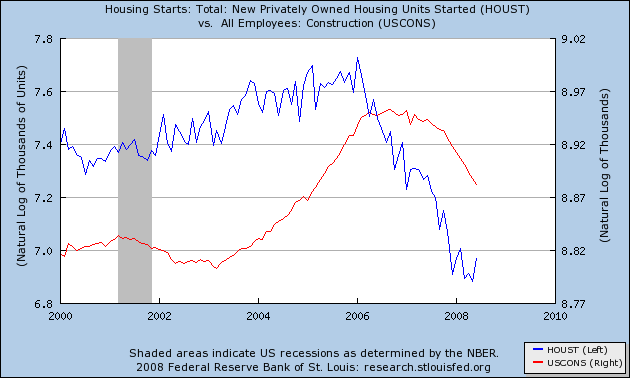
| Housing Permits (New) | Housing Starts (New) |
 |
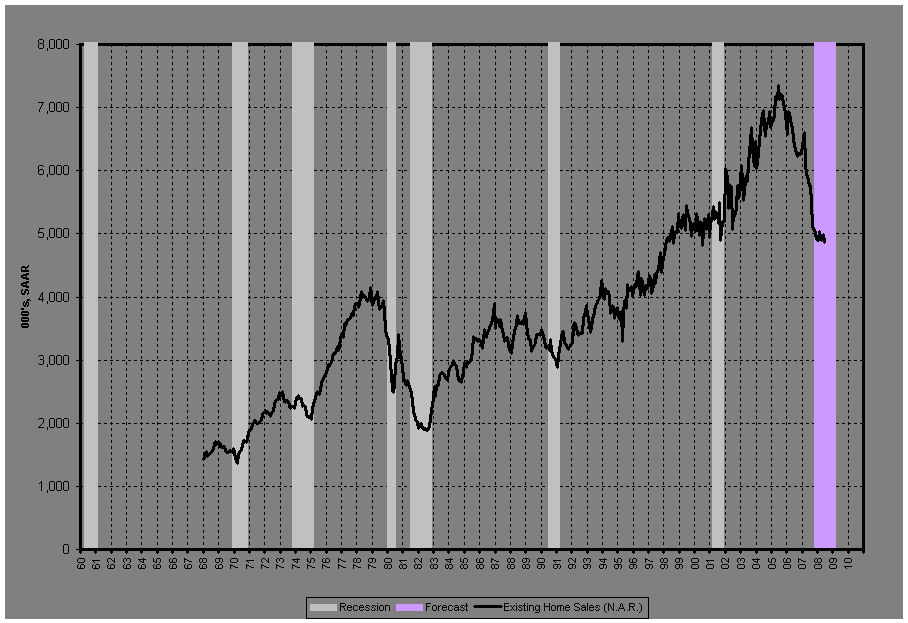 |
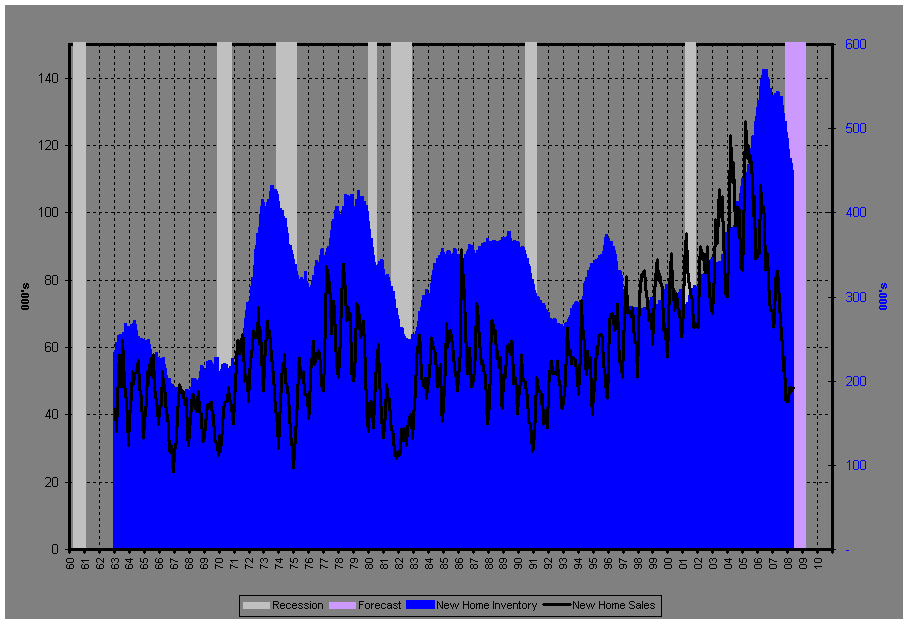
| Home Sales (New) vs Inventory | Home Sales (Existing), adjusted & annualized |
 |
|
| Housing/Jobs Disconnect | n/a |
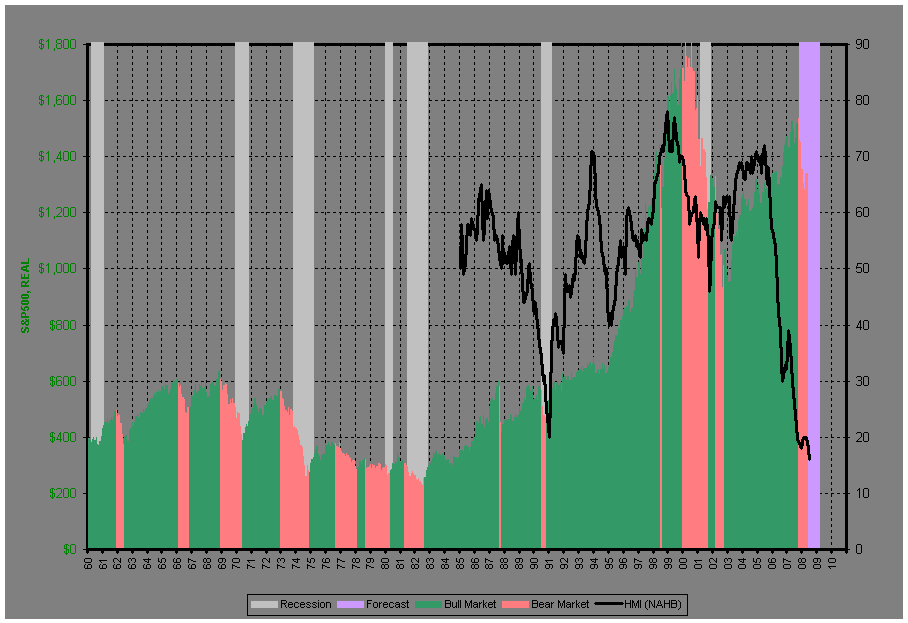
| Housing Market Index (HMI) vs S&P500 | |
 |
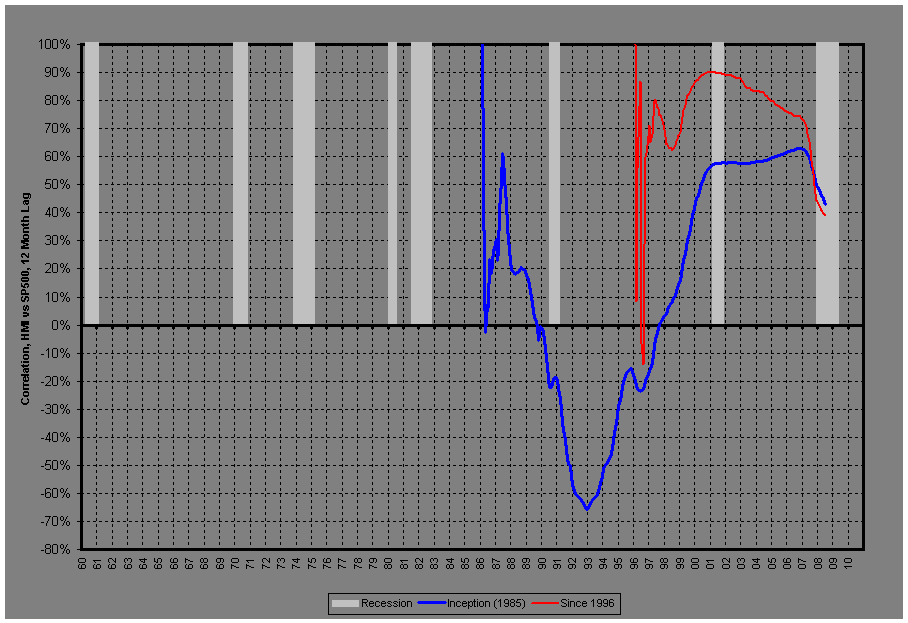 |
| HMI vs. CPI adjusted S&P 500 | Correlation Analysis, 12 month lag |
INFLATION - Govt. Measures
 |
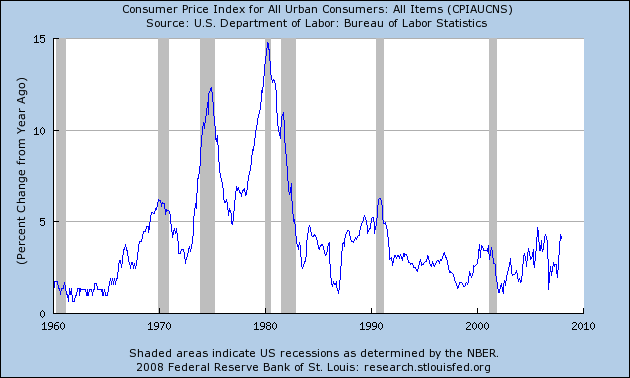 |
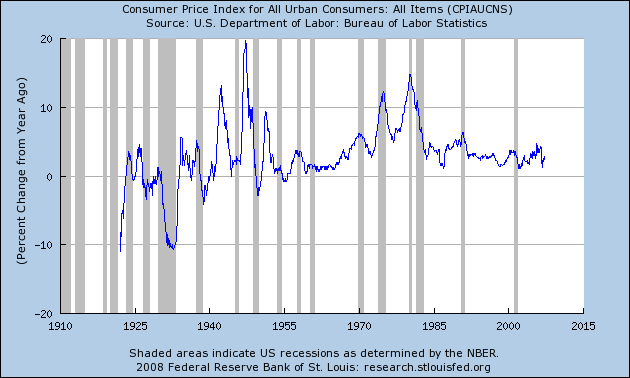
| Inflation CPI-U (current methodology, from 1921) | Inflation CPI-U (current methodology, from 1960) |
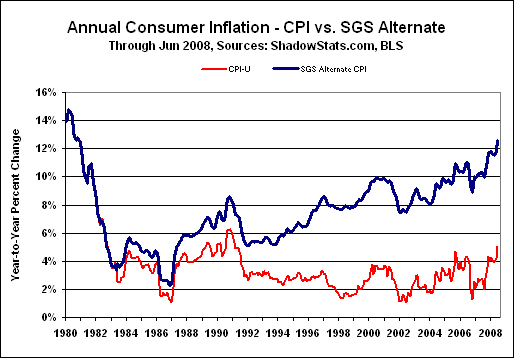
INFLATION - Alternate Measures
|
INFLATION: Questionable Statistics Essay |
|
 |
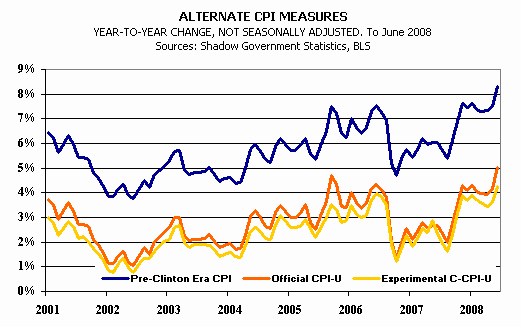 |
| Long Term (based on 1980 methodology) | Short Term (based on 1990 methodology) |
 |
 |
INFLATION vs. INCOME
 |
|
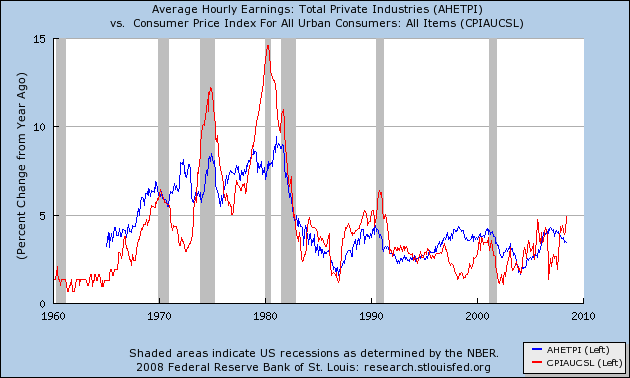
| Growth in Inflation vs Hourly Earnings | n/a |
GOVT INCOME
 |
|
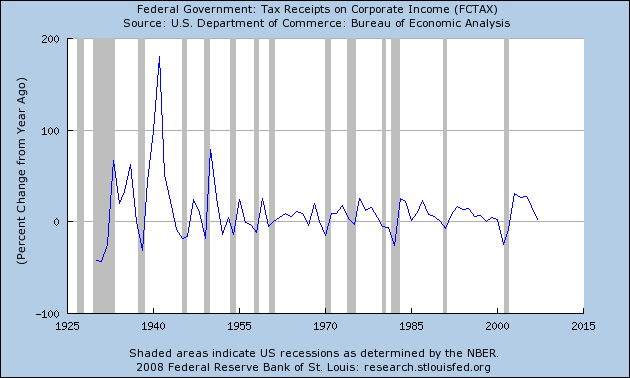
| Federal Tax Receipts, Corporate, Annual | n/a |